Article series
This is the second of two articles describing different aspects of observability of Hilla apps:
Observability in the browser
Collecting logs, traces and metrics poses certain challenges for developers, as the browser is far away and not under their control. Nevertheless, it is very important to know when errors or problems occur in the React frontend of a Hilla app in the browser and how users experience the Hilla app. Fortunately, there are approaches for continuously observing a React frontend in the browser. Similar to the Spring Boot backend, OpenTelemetry can also be used for this purpose in the React frontend of a Hilla app. At the time this article was written, the OpenTelemetry documentation for JavaScript in the browser contained the following warning:
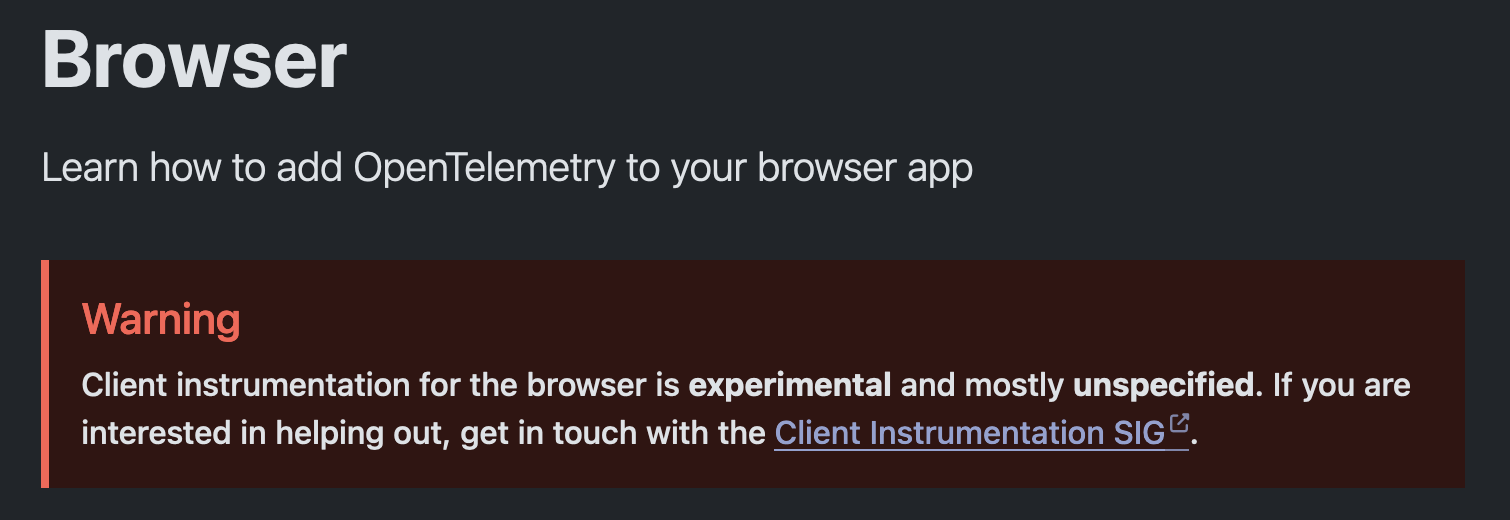
This means that some of the approaches presented below may still be incomplete or subject to change. Nevertheless, it is interesting to see what possibilities already exist today at the current stage of development.
Setup
Integrating OpenTelemetry into the React frontend of a Hilla app starts with adding some required basic dependencies:
npm install --save @opentelemetry/api \
@opentelemetry/core \
@opentelemetry/resources \
@opentelemetry/semantic-conventions
A file open-telemetry.ts can now be created in the src/main/frontend directory. This file will later contain all the required configuration for OpenTelemetry in the frontend. The file initially contains the following content:
import { Resource } from "@opentelemetry/resources";
import {
  ATTR_SERVICE_NAME,
  ATTR_SERVICE_VERSION,
} from "@opentelemetry/semantic-conventions";

const resourceSettings = new Resource({
  [ATTR_SERVICE_NAME]: "hilla-observability-example-frontend",
  [ATTR_SERVICE_VERSION]: "1.0.0",
});
The Resource describes the service for which traces and metrics are to be collected later. The description of the Resource is done via semantic conventions, which OpenTelemetry provides as constants.
The file open-telemetry.ts must be executed very early in the React frontend. To do this, the script is included in the src/main/frontend/index.html file:
<!DOCTYPE html>
<html lang="en">
  <head>
    <!-- existing code omitted -->
    <script type="module" src="open-telemetry.ts"></script>
  </head>

  <body>
    <div id="outlet"></div>
  </body>
</html>
Tracing
Tracing is helpful to understand how users interact with the React frontend of a Hilla app. Traces can occur, for example, when HTTP requests to the backend are executed, when users navigate to views within the frontend or interact with buttons.
A suitable TraceProvider must be configured so that traces can be used in the frontend. A WebTracerProvider is used for the React frontend of a Hilla app:
npm install --save @opentelemetry/sdk-trace-web
import { Resource } from "@opentelemetry/resources";
import { WebTracerProvider } from "@opentelemetry/sdk-trace-web";
import {
  ATTR_SERVICE_NAME,
  ATTR_SERVICE_VERSION,
} from "@opentelemetry/semantic-conventions";

const resourceSettings = new Resource({
  [ATTR_SERVICE_NAME]: "hilla-observability-example-frontend",
  [ATTR_SERVICE_VERSION]: "1.0.0",
});

const provider = new WebTracerProvider({ resource: resourceSettings });
In conjunction with the WebTraceProvider, a suitable Exporter is also configured via which the generated traces can be exported. In this example, an OTLPTraceExporter is used, which exports the traces via the OpenTelemetry Protocol (OTLP) to a suitable backend, such as SigNoz:
npm install --save @opentelemetry/exporter-trace-otlp-http
import { OTLPTraceExporter } from "@opentelemetry/exporter-trace-otlp-http";
import { Resource } from "@opentelemetry/resources";
import { WebTracerProvider } from "@opentelemetry/sdk-trace-web";
import {
  ATTR_SERVICE_NAME,
  ATTR_SERVICE_VERSION,
} from "@opentelemetry/semantic-conventions";

const resourceSettings = new Resource({
  [ATTR_SERVICE_NAME]: "hilla-observability-example-frontend",
  [ATTR_SERVICE_VERSION]: "1.0.0",
});

const provider = new WebTracerProvider({ resource: resourceSettings });

const otlpTraceExporter = new OTLPTraceExporter({
  url: "http://corporate.observability.example.com:4318/v1/traces",
});
The TraceProvider must now be configured with a suitable SpanProcessor. All spans created in the React frontend are processed via the SpanProcessor. A typical SpanProcessor is the BatchSpanProcessor, which collects spans in a configurable way and transfers them to the Exporter:
import { OTLPTraceExporter } from "@opentelemetry/exporter-trace-otlp-http";
import { Resource } from "@opentelemetry/resources";
import {
  BatchSpanProcessor,
  WebTracerProvider,
} from "@opentelemetry/sdk-trace-web";
import {
  ATTR_SERVICE_NAME,
  ATTR_SERVICE_VERSION,
} from "@opentelemetry/semantic-conventions";

const resourceSettings = new Resource({
  [ATTR_SERVICE_NAME]: "hilla-observability-example-frontend",
  [ATTR_SERVICE_VERSION]: "1.0.0",
});

const provider = new WebTracerProvider({ resource: resourceSettings });

const otlpTraceExporter = new OTLPTraceExporter({
  url: "http://corporate.observability.example.com:4318/v1/traces",
});

provider.addSpanProcessor(new BatchSpanProcessor(otlpTraceExporter));
For testing and/or debugging purposes, a combination of ConsoleSpanExporter and SimpleSpanProcessor can be used as an alternative to the combination of OTLPTraceExporter and BatchSpanProcessor. In this case, all spans are shown immediately via the browser console:
provider.addSpanProcessor(new SimpleSpanProcessor(new ConsoleSpanExporter()));
In order for spans and traces to be correlated in a common context, a suitable Context must be provided via the ZoneContextManager:
npm install --save @opentelemetry/context-zone
import { ZoneContextManager } from "@opentelemetry/context-zone";
import { OTLPTraceExporter } from "@opentelemetry/exporter-trace-otlp-http";
import { Resource } from "@opentelemetry/resources";
import {
  BatchSpanProcessor,
  WebTracerProvider,
} from "@opentelemetry/sdk-trace-web";
import {
  ATTR_SERVICE_NAME,
  ATTR_SERVICE_VERSION,
} from "@opentelemetry/semantic-conventions";

const resourceSettings = new Resource({
  [ATTR_SERVICE_NAME]: "hilla-observability-example-frontend",
  [ATTR_SERVICE_VERSION]: "1.0.0",
});

const provider = new WebTracerProvider({ resource: resourceSettings });

const otlpTraceExporter = new OTLPTraceExporter({
  url: "http://corporate.observability.example.com:4318/v1/traces",
});

provider.addSpanProcessor(new BatchSpanProcessor(otlpTraceExporter));

provider.register({
  contextManager: new ZoneContextManager()
})
Various instrumentations that can collect traces in the React frontend of a Hilla app can now be added. OpenTelemetry currently provides 4 auto-instrumentations for a web frontend:
- @opentelemetry/instrumentation-document-load
- @opentelemetry/instrumentation-fetch
- @opentelemetry/instrumentation-user-interaction
- @opentelemetry/instrumentation-xml-http-request
To be able to use these instrumentations, the package @opentelemetry/instrumentation must first be installed and integrated in the OpenTelemetry setup:
npm install --save @opentelemetry/instrumentation
import { ZoneContextManager } from "@opentelemetry/context-zone";
import { OTLPTraceExporter } from "@opentelemetry/exporter-trace-otlp-http";
import { registerInstrumentations } from '@opentelemetry/instrumentation';
import { Resource } from "@opentelemetry/resources";
import {
  BatchSpanProcessor,
  WebTracerProvider,
} from "@opentelemetry/sdk-trace-web";
import {
  ATTR_SERVICE_NAME,
  ATTR_SERVICE_VERSION,
} from "@opentelemetry/semantic-conventions";

const resourceSettings = new Resource({
  [ATTR_SERVICE_NAME]: "hilla-observability-example-frontend",
  [ATTR_SERVICE_VERSION]: "1.0.0",
});

const provider = new WebTracerProvider({ resource: resourceSettings });

const otlpTraceExporter = new OTLPTraceExporter({
  url: "http://corporate.observability.example.com:4318/v1/traces",
});

provider.addSpanProcessor(new BatchSpanProcessor(otlpTraceExporter));

provider.register({
  contextManager: new ZoneContextManager()
})

const startOpenTelemetryInstrumentation = () => {
  registerInstrumentations({
    instrumentations: [],
  });
};

startOpenTelemetryInstrumentation();
The auto-instrumentation can then be added. First, the package @opentelemetry/instrumentation-fetch is installed and integrated:
npm install --save @opentelemetry/instrumentation-fetch
import { ZoneContextManager } from "@opentelemetry/context-zone";
import { OTLPTraceExporter } from "@opentelemetry/exporter-trace-otlp-http";
import { registerInstrumentations } from '@opentelemetry/instrumentation';
import { FetchInstrumentation } from '@opentelemetry/instrumentation-fetch';
import { Resource } from "@opentelemetry/resources";
import {
  BatchSpanProcessor,
  WebTracerProvider,
} from "@opentelemetry/sdk-trace-web";
import {
  ATTR_SERVICE_NAME,
  ATTR_SERVICE_VERSION,
} from "@opentelemetry/semantic-conventions";

const resourceSettings = new Resource({
  [ATTR_SERVICE_NAME]: "hilla-observability-example-frontend",
  [ATTR_SERVICE_VERSION]: "1.0.0",
});

const provider = new WebTracerProvider({ resource: resourceSettings });

const otlpTraceExporter = new OTLPTraceExporter({
  url: "http://corporate.observability.example.com:4318/v1/traces",
});

provider.addSpanProcessor(new BatchSpanProcessor(otlpTraceExporter));

provider.register({
  contextManager: new ZoneContextManager()
})

const startOpenTelemetryInstrumentation = () => {
  registerInstrumentations({
    instrumentations: [
      new FetchInstrumentation({
        ignoreUrls: [/VAADIN/],
      }),
    ],
  });
};

startOpenTelemetryInstrumentation();
With the help of instrumentation-fetch, the HTTP requests that are sent via the fetch-API from the React frontend to the Spring Boot backend of a Hilla app are recorded. In the configuration, HTTP requests to URLs with the path /VAADIN/ are ignored, as these are internal requests of the framework. This is an example trace for a regular HTTP request to an endpoint named AccommodationService:
{
  "resource": {
    "attributes": {
      "service.name": "hilla-observability-example-frontend",
      "telemetry.sdk.language": "webjs",
      "telemetry.sdk.name": "opentelemetry",
      "telemetry.sdk.version": "1.27.0",
      "service.version": "1.0.0"
    }
  },
  "instrumentationScope": {
    "name": "@opentelemetry/instrumentation-fetch",
    "version": "0.54.0"
  },
  "traceId": "44fcb174427ef9069c01c743ed0af28e",
  "name": "HTTP POST",
  "id": "2bda0ea4c46953d9",
  "kind": 2,
  "timestamp": 1730660709096000,
  "duration": 653000,
  "attributes": {
    "component": "fetch",
    "http.method": "POST",
    "http.url": "http://localhost:8080/connect/AccommodationService/list",
    "http.status_code": 200,
    "http.status_text": "",
    "http.host": "localhost:8080",
    "http.scheme": "http",
    "http.user_agent": "Mozilla/5.0 (Macintosh; Intel Mac OS X 10.15; rv:131.0) Gecko/20100101 Firefox/131.0",
    "http.response_content_length": 1178
  },
  "status": {
    "code": 0
  },
  "events": [
    {
      "name": "fetchStart",
      "attributes": {},
      "time": [
        1730660709,
        97000000
      ],
      "droppedAttributesCount": 0
    },
    {
      "name": "domainLookupStart",
      "attributes": {},
      "time": [
        1730660709,
        97000000
      ],
      "droppedAttributesCount": 0
    },
    {
      "name": "domainLookupEnd",
      "attributes": {},
      "time": [
        1730660709,
        97000000
      ],
      "droppedAttributesCount": 0
    },
    {
      "name": "connectStart",
      "attributes": {},
      "time": [
        1730660709,
        97000000
      ],
      "droppedAttributesCount": 0
    },
    {
      "name": "connectEnd",
      "attributes": {},
      "time": [
        1730660709,
        97000000
      ],
      "droppedAttributesCount": 0
    },
    {
      "name": "requestStart",
      "attributes": {},
      "time": [
        1730660709,
        100000000
      ],
      "droppedAttributesCount": 0
    },
    {
      "name": "responseStart",
      "attributes": {},
      "time": [
        1730660709,
        746000000
      ],
      "droppedAttributesCount": 0
    },
    {
      "name": "responseEnd",
      "attributes": {},
      "time": [
        1730660709,
        746000000
      ],
      "droppedAttributesCount": 0
    }
  ],
  "links": []
}
The next auto-instrumentation is @opentelemetry/instrumentation-document-load. This instrumentation can be used to record how long it takes to load individual pages in the frontend.
npm install --save @opentelemetry/instrumentation-document-load
import { ZoneContextManager } from "@opentelemetry/context-zone";
import { OTLPTraceExporter } from "@opentelemetry/exporter-trace-otlp-http";
import { registerInstrumentations } from '@opentelemetry/instrumentation';
import { DocumentLoadInstrumentation } from '@opentelemetry/instrumentation-document-load';
import { FetchInstrumentation } from '@opentelemetry/instrumentation-fetch';
import { Resource } from "@opentelemetry/resources";
import {
  BatchSpanProcessor,
  WebTracerProvider,
} from "@opentelemetry/sdk-trace-web";
import {
  ATTR_SERVICE_NAME,
  ATTR_SERVICE_VERSION,
} from "@opentelemetry/semantic-conventions";

const resourceSettings = new Resource({
  [ATTR_SERVICE_NAME]: "hilla-observability-example-frontend",
  [ATTR_SERVICE_VERSION]: "1.0.0",
});

const provider = new WebTracerProvider({ resource: resourceSettings });

const otlpTraceExporter = new OTLPTraceExporter({
  url: "http://corporate.observability.example.com:4318/v1/traces",
});

provider.addSpanProcessor(new BatchSpanProcessor(otlpTraceExporter));

provider.register({
  contextManager: new ZoneContextManager()
})

const startOpenTelemetryInstrumentation = () => {
  registerInstrumentations({
    instrumentations: [
      new FetchInstrumentation({
        ignoreUrls: [/VAADIN/],
      }),
      new DocumentLoadInstrumentation(),
    ],
  });
};

startOpenTelemetryInstrumentation();
The documentFetch event is used to record how long it took to retrieve a page in the frontend:
{
  "resource": {
    "attributes": {
      "service.name": "hilla-observability-example-frontend",
      "telemetry.sdk.language": "webjs",
      "telemetry.sdk.name": "opentelemetry",
      "telemetry.sdk.version": "1.27.0",
      "service.version": "1.0.0"
    }
  },
  "instrumentationScope": {
    "name": "@opentelemetry/instrumentation-document-load",
    "version": "0.41.0"
  },
  "traceId": "912887b8c9901a691f106102923dcdca",
  "parentId": "4edb53d5cf305c2f",
  "name": "documentFetch",
  "id": "0b82df008473b4a6",
  "kind": 0,
  "timestamp": 1730718087008000,
  "duration": 52000,
  "attributes": {
    "http.url": "http://localhost:8080/events",
    "http.response_content_length": 8501
  },
  "status": {
    "code": 0
  },
  "events": [
    {
      "name": "fetchStart",
      "attributes": {},
      "time": [
        1730718087,
        8000000
      ],
      "droppedAttributesCount": 0
    },
    {
      "name": "domainLookupStart",
      "attributes": {},
      "time": [
        1730718087,
        8000000
      ],
      "droppedAttributesCount": 0
    },
    {
      "name": "domainLookupEnd",
      "attributes": {},
      "time": [
        1730718087,
        8000000
      ],
      "droppedAttributesCount": 0
    },
    {
      "name": "connectStart",
      "attributes": {},
      "time": [
        1730718087,
        8000000
      ],
      "droppedAttributesCount": 0
    },
    {
      "name": "connectEnd",
      "attributes": {},
      "time": [
        1730718087,
        8000000
      ],
      "droppedAttributesCount": 0
    },
    {
      "name": "requestStart",
      "attributes": {},
      "time": [
        1730718087,
        39000000
      ],
      "droppedAttributesCount": 0
    },
    {
      "name": "responseStart",
      "attributes": {},
      "time": [
        1730718087,
        60000000
      ],
      "droppedAttributesCount": 0
    },
    {
      "name": "responseEnd",
      "attributes": {},
      "time": [
        1730718087,
        60000000
      ],
      "droppedAttributesCount": 0
    }
  ],
  "links": []
}
The documentLoad event is used to record how long it took to fully load a page in the frontend:
{
  "resource": {
    "attributes": {
      "service.name": "hilla-observability-example-frontend",
      "telemetry.sdk.language": "webjs",
      "telemetry.sdk.name": "opentelemetry",
      "telemetry.sdk.version": "1.27.0",
      "service.version": "1.0.0"
    }
  },
  "instrumentationScope": {
    "name": "@opentelemetry/instrumentation-document-load",
    "version": "0.41.0"
  },
  "traceId": "912887b8c9901a691f106102923dcdca",
  "name": "documentLoad",
  "id": "4edb53d5cf305c2f",
  "kind": 0,
  "timestamp": 1730718087008000,
  "duration": 2570000,
  "attributes": {
    "http.url": "http://localhost:8080/events",
    "http.user_agent": "Mozilla/5.0 (Macintosh; Intel Mac OS X 10.15; rv:131.0) Gecko/20100101 Firefox/131.0"
  },
  "status": {
    "code": 0
  },
  "events": [
    {
      "name": "fetchStart",
      "attributes": {},
      "time": [
        1730718087,
        8000000
      ],
      "droppedAttributesCount": 0
    },
    {
      "name": "unloadEventStart",
      "attributes": {},
      "time": [
        1730718087,
        62000000
      ],
      "droppedAttributesCount": 0
    },
    {
      "name": "unloadEventEnd",
      "attributes": {},
      "time": [
        1730718087,
        63000000
      ],
      "droppedAttributesCount": 0
    },
    {
      "name": "domInteractive",
      "attributes": {},
      "time": [
        1730718087,
        195000000
      ],
      "droppedAttributesCount": 0
    },
    {
      "name": "domContentLoadedEventStart",
      "attributes": {},
      "time": [
        1730718089,
        566000000
      ],
      "droppedAttributesCount": 0
    },
    {
      "name": "domContentLoadedEventEnd",
      "attributes": {},
      "time": [
        1730718089,
        569000000
      ],
      "droppedAttributesCount": 0
    },
    {
      "name": "domComplete",
      "attributes": {},
      "time": [
        1730718089,
        576000000
      ],
      "droppedAttributesCount": 0
    },
    {
      "name": "loadEventStart",
      "attributes": {},
      "time": [
        1730718089,
        576000000
      ],
      "droppedAttributesCount": 0
    },
    {
      "name": "loadEventEnd",
      "attributes": {},
      "time": [
        1730718089,
        578000000
      ],
      "droppedAttributesCount": 0
    },
    {
      "name": "firstContentfulPaint",
      "attributes": {},
      "time": [
        1730718089,
        546000000
      ],
      "droppedAttributesCount": 0
    }
  ],
  "links": []
}
Due to the dynamic characteristics of Single Page Applications (SPA), it is not so easy to determine the exact time when a page has been fully loaded. There are various lifecycle events, such as domComplete or firstContentfulPaint, which provide clues here.
By default, the loading of all resources, including JavaScript or CSS files, is also recorded with @opentelemetry/instrumentation-document-load. If you do not want this, you can exclude the associated event in the Sampler of the WebTraceProvider:
import { ZoneContextManager } from '@opentelemetry/context-zone';
import { OTLPTraceExporter } from "@opentelemetry/exporter-trace-otlp-http";
import { registerInstrumentations } from '@opentelemetry/instrumentation';
import { DocumentLoadInstrumentation } from '@opentelemetry/instrumentation-document-load';
import { FetchInstrumentation } from '@opentelemetry/instrumentation-fetch';
import { Resource } from '@opentelemetry/resources';
import {
  BatchSpanProcessor,
  SamplingDecision,
  WebTracerProvider,
} from '@opentelemetry/sdk-trace-web';
import { ATTR_SERVICE_NAME, ATTR_SERVICE_VERSION } from '@opentelemetry/semantic-conventions';

const resourceSettings = new Resource({
  [ATTR_SERVICE_NAME]: 'hilla-observability-example-frontend',
  [ATTR_SERVICE_VERSION]: '1.0.0',
});

const provider = new WebTracerProvider({
  resource: resourceSettings,
  sampler: {
    shouldSample: (_context, _traceId, spanName) => {
      return {
        decision: spanName == 'resourceFetch' ? SamplingDecision.NOT_RECORD : SamplingDecision.RECORD_AND_SAMPLED,
      };
    },
  },
});

const otlpTraceExporter = new OTLPTraceExporter({
  url: "http://corporate.observability.example.com:4318/v1/traces",
});

provider.addSpanProcessor(new BatchSpanProcessor(otlpTraceExporter));

provider.register({
  contextManager: new ZoneContextManager(),
});

const startOpenTelemetryInstrumentation = () => {
  registerInstrumentations({
    instrumentations: [
      new FetchInstrumentation({
        ignoreUrls: [/VAADIN/],
      }),
      new DocumentLoadInstrumentation(),
    ],
  });
};

startOpenTelemetryInstrumentation();
The third auto-instrumentation is @opentelemetry/instrumentation-user-interaction. This instrumentation can be used to record user interactions. By default, only click events are recorded. This can be extended to most standard events if required. The click event is usually sufficient for the React frontend of a Hilla app.
npm install --save @opentelemetry/instrumentation-user-interaction
import { ZoneContextManager } from '@opentelemetry/context-zone';
import { OTLPTraceExporter } from "@opentelemetry/exporter-trace-otlp-http";
import { registerInstrumentations } from '@opentelemetry/instrumentation';
import { DocumentLoadInstrumentation } from '@opentelemetry/instrumentation-document-load';
import { FetchInstrumentation } from '@opentelemetry/instrumentation-fetch';
import { UserInteractionInstrumentation } from '@opentelemetry/instrumentation-user-interaction';
import { Resource } from '@opentelemetry/resources';
import {
  BatchSpanProcessor,
  SamplingDecision,
  WebTracerProvider,
} from '@opentelemetry/sdk-trace-web';
import { ATTR_SERVICE_NAME, ATTR_SERVICE_VERSION } from '@opentelemetry/semantic-conventions';

const resourceSettings = new Resource({
  [ATTR_SERVICE_NAME]: 'hilla-observability-example-frontend',
  [ATTR_SERVICE_VERSION]: '1.0.0',
});

const provider = new WebTracerProvider({
  resource: resourceSettings,
  sampler: {
    shouldSample: (_context, _traceId, spanName) => {
      return {
        decision: spanName == 'resourceFetch' ? SamplingDecision.NOT_RECORD : SamplingDecision.RECORD_AND_SAMPLED,
      };
    },
  },
});

const otlpTraceExporter = new OTLPTraceExporter({
  url: "http://corporate.observability.example.com:4318/v1/traces",
});

provider.addSpanProcessor(new BatchSpanProcessor(otlpTraceExporter));

provider.register({
  contextManager: new ZoneContextManager(),
});

const startOpenTelemetryInstrumentation = () => {
  registerInstrumentations({
    instrumentations: [
      new FetchInstrumentation({
        ignoreUrls: [/VAADIN/],
      }),
      new DocumentLoadInstrumentation(),
      new UserInteractionInstrumentation(),
    ],
  });
};

startOpenTelemetryInstrumentation();
The following trace results from a click on the drawer menu of a Hilla app:
{
  "resource": {
    "attributes": {
      "service.name": "hilla-observability-example-frontend",
      "telemetry.sdk.language": "webjs",
      "telemetry.sdk.name": "opentelemetry",
      "telemetry.sdk.version": "1.27.0",
      "service.version": "1.0.0"
    }
  },
  "instrumentationScope": {
    "name": "@opentelemetry/instrumentation-user-interaction",
    "version": "0.41.0"
  },
  "traceId": "9c234033deb0a926818226af9e82d4a7",
  "name": "click",
  "id": "6811cf1bae4b0823",
  "kind": 0,
  "timestamp": 1730721585131000,
  "duration": 0,
  "attributes": {
    "event_type": "click",
    "target_element": "VAADIN-DRAWER-TOGGLE",
    "target_xpath": "//html/body/div/vaadin-app-layout/vaadin-drawer-toggle",
    "http.url": "http://localhost:8080/events"
  },
  "status": {
    "code": 0
  },
  "events": [],
  "links": []
}
This trace results from a click on a line within the grid component:
{
  "resource": {
    "attributes": {
      "service.name": "hilla-observability-example-frontend",
      "telemetry.sdk.language": "webjs",
      "telemetry.sdk.name": "opentelemetry",
      "telemetry.sdk.version": "1.27.0",
      "service.version": "1.0.0"
    }
  },
  "instrumentationScope": {
    "name": "@opentelemetry/instrumentation-user-interaction",
    "version": "0.41.0"
  },
  "traceId": "883427cd120292ca93e2756dbad895ea",
  "name": "click",
  "id": "5f008ad9e2cd9caf",
  "kind": 0,
  "timestamp": 1730721655936000,
  "duration": 1000,
  "attributes": {
    "event_type": "click",
    "target_element": "VAADIN-GRID-CELL-CONTENT",
    "target_xpath": "//html/body/div/vaadin-app-layout/vaadin-vertical-layout/vaadin-grid/vaadin-grid-cell-content[36]",
    "http.url": "http://localhost:8080/events"
  },
  "status": {
    "code": 0
  },
  "events": [],
  "links": []
}
This trace results from a click on a button that triggers a navigation to another page:
{
  "resource": {
    "attributes": {
      "service.name": "hilla-observability-example-frontend",
      "telemetry.sdk.language": "webjs",
      "telemetry.sdk.name": "opentelemetry",
      "telemetry.sdk.version": "1.27.0",
      "service.version": "1.0.0"
    }
  },
  "instrumentationScope": {
    "name": "@opentelemetry/instrumentation-user-interaction",
    "version": "0.41.0"
  },
  "traceId": "275241a3b2bc496923c4de6f6b368c0c",
  "name": "Navigation: /events/new",
  "id": "058cf98572a55d73",
  "kind": 0,
  "timestamp": 1730721693994000,
  "duration": 3000,
  "attributes": {
    "event_type": "click",
    "target_element": "VAADIN-BUTTON",
    "target_xpath": "//html/body/div/vaadin-app-layout/vaadin-vertical-layout/vaadin-horizontal-layout/vaadin-button",
    "http.url": "http://localhost:8080/events"
  },
  "status": {
    "code": 0
  },
  "events": [],
  "links": []
}
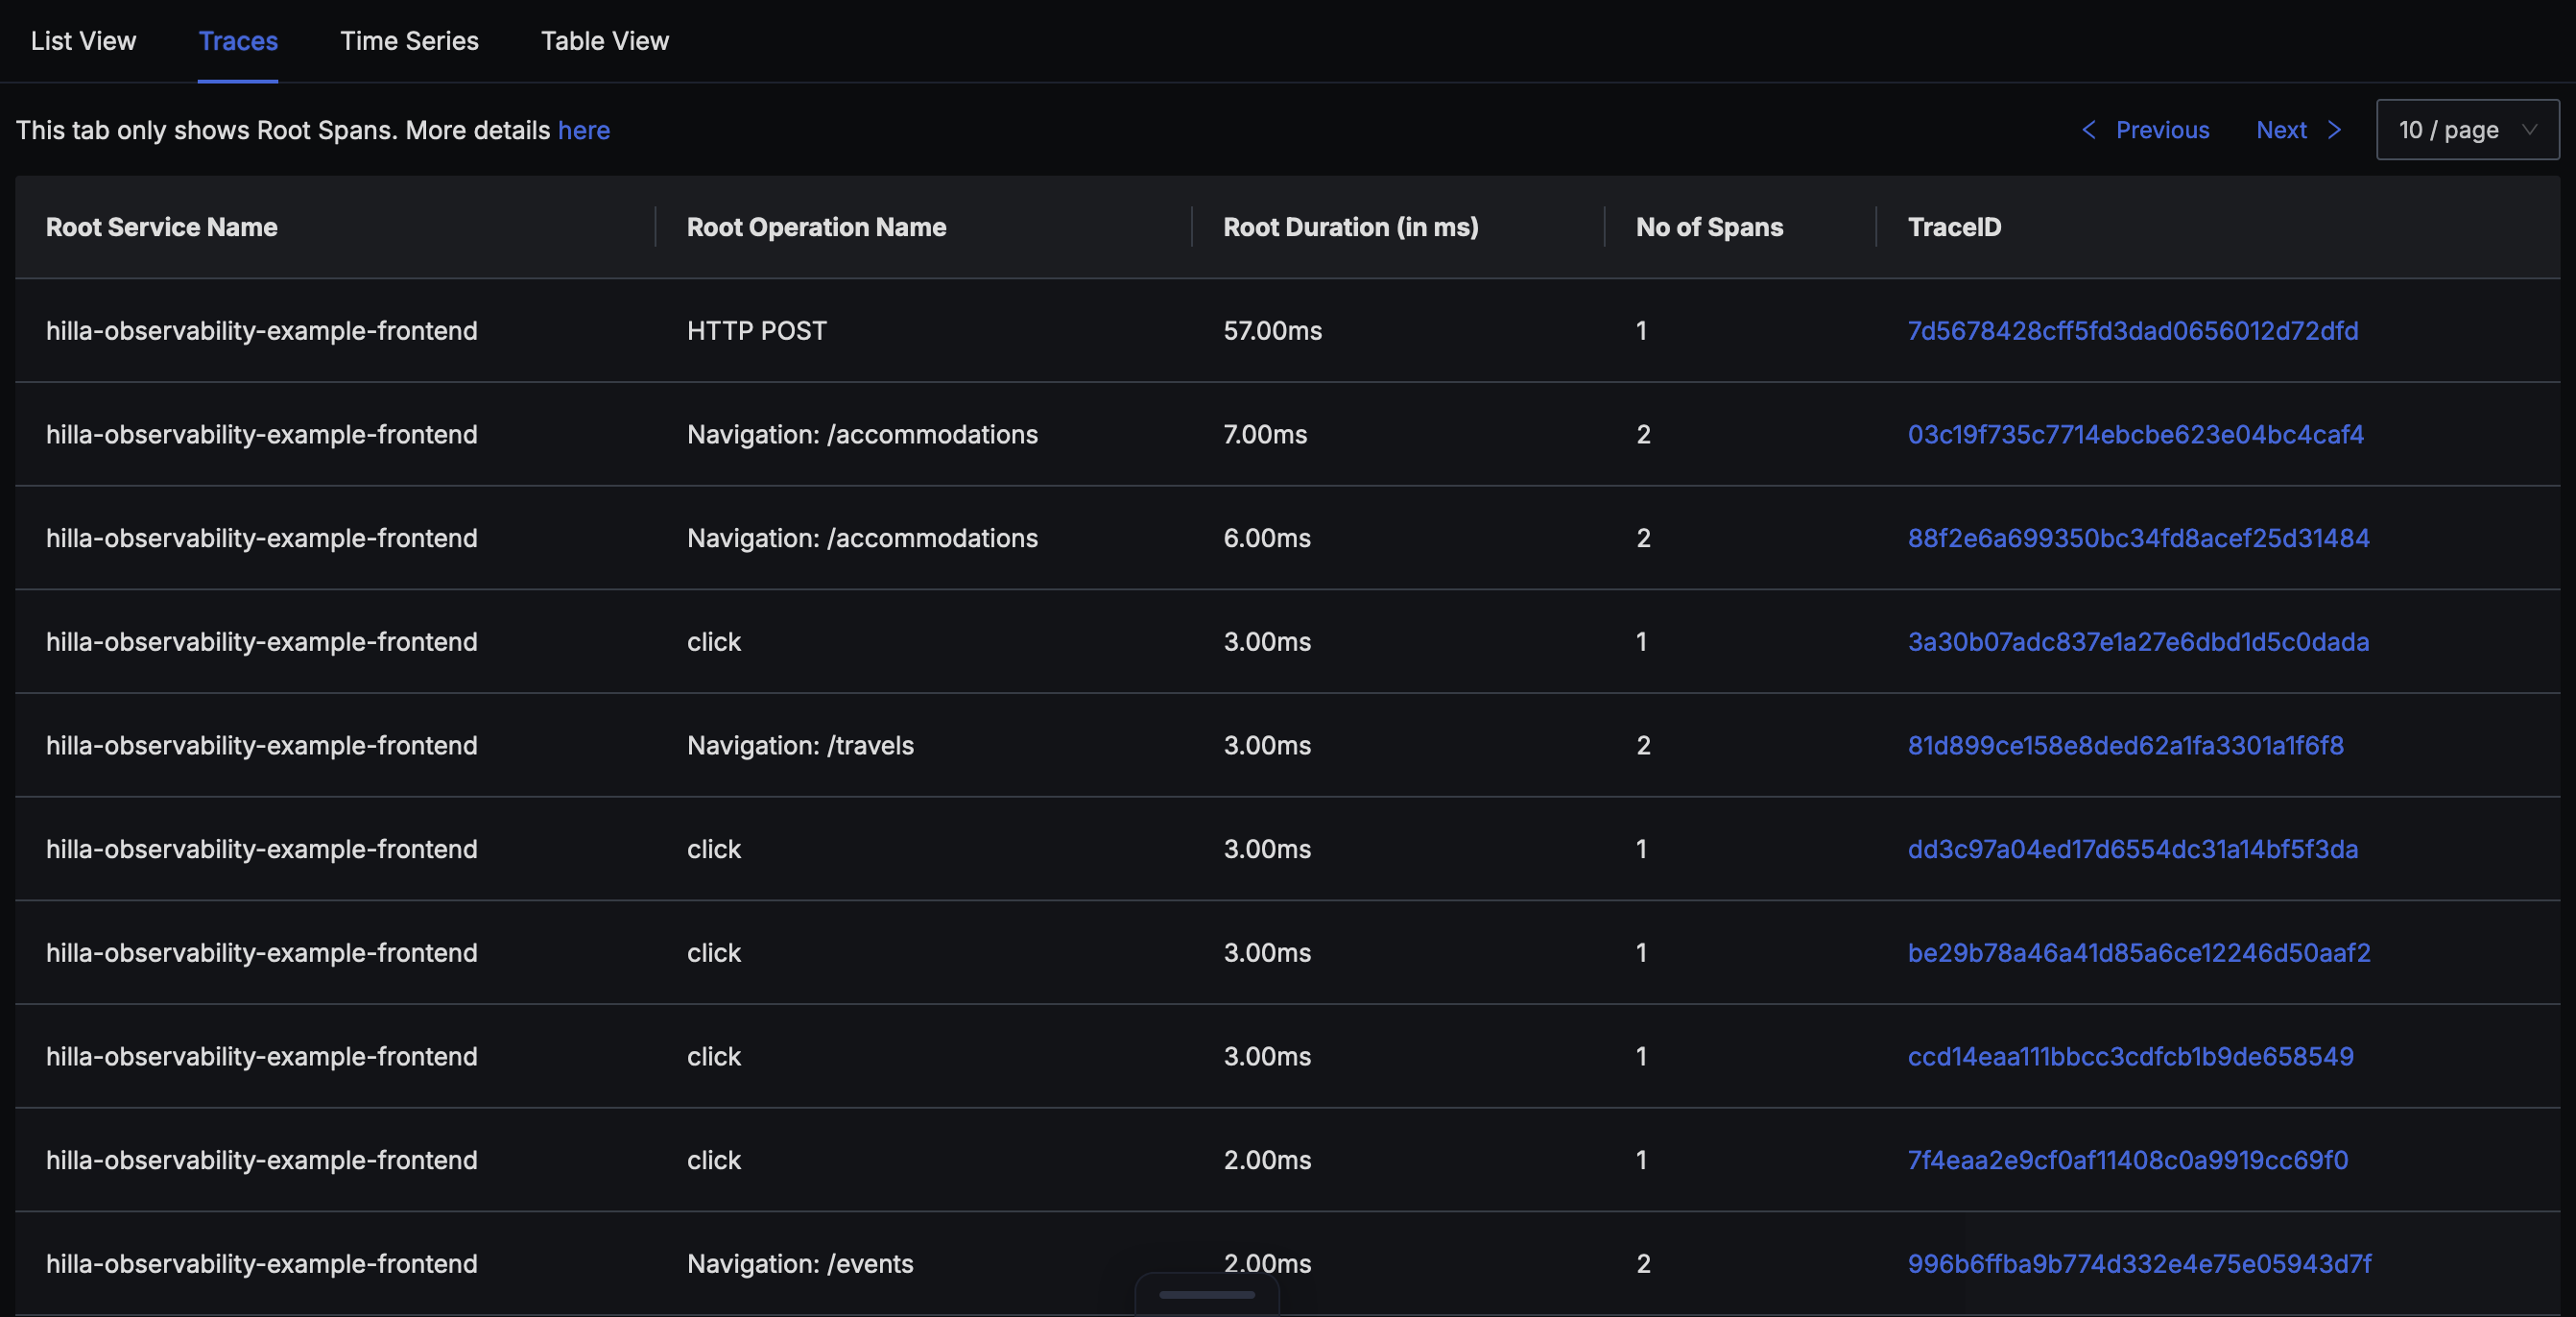
The collected traces can be analyzed and evaluated in a suitable backend. In a trace backend such as SigNoz, for example, all traces can be viewed:
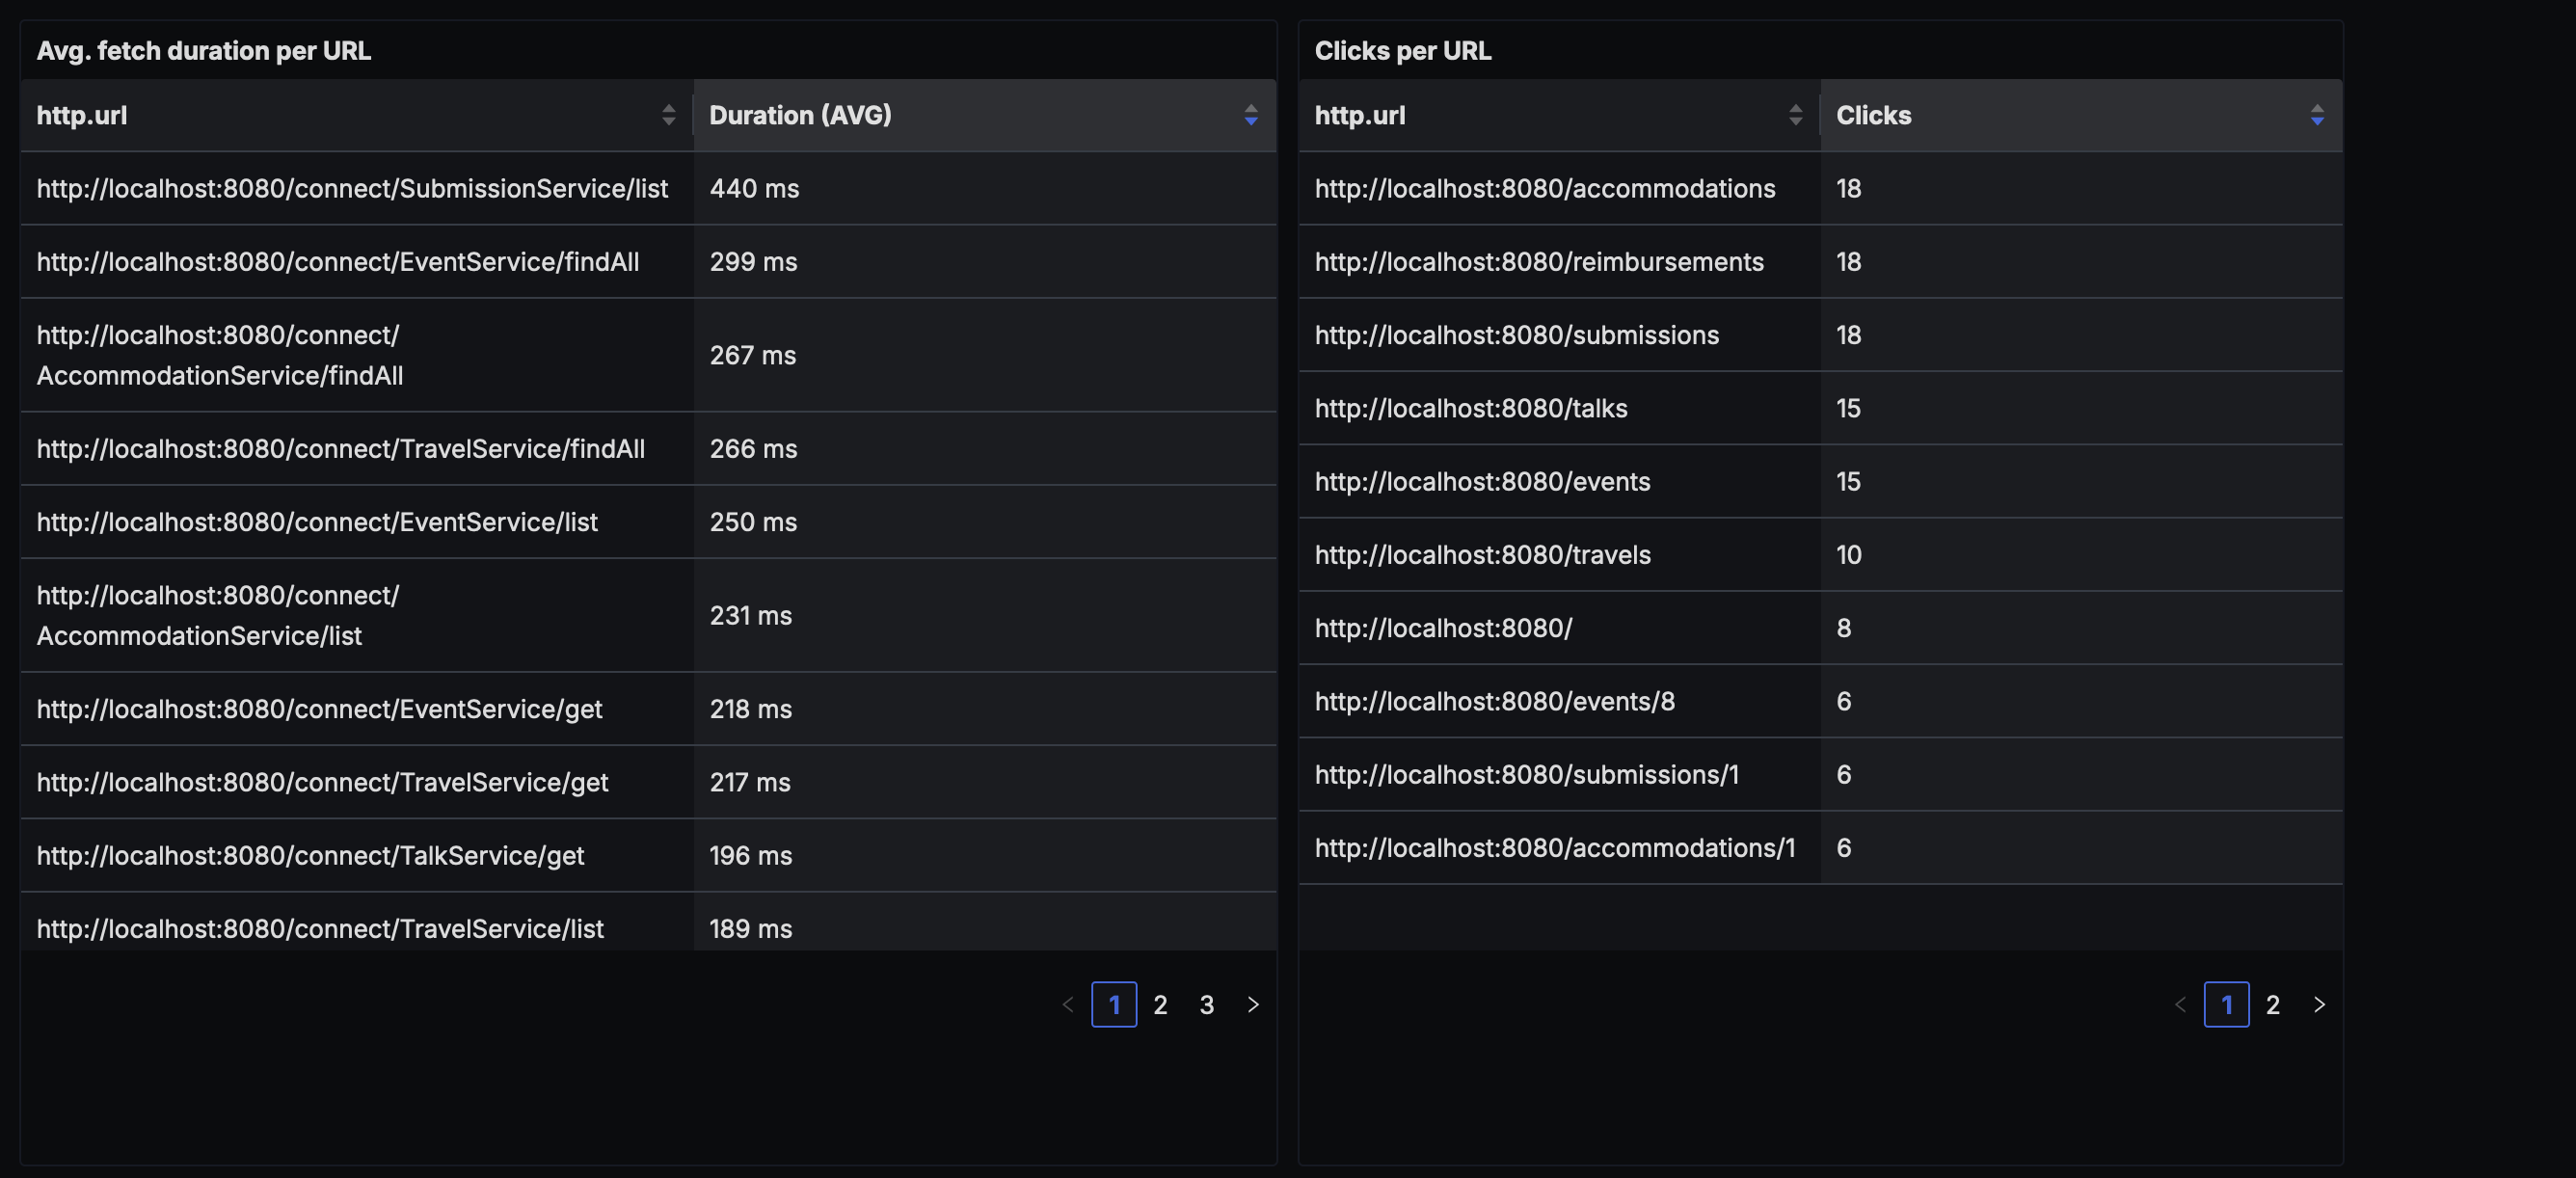
Based on the traces, dashboards can also be created in SigNoz. The following dashboards show examples of the average duration of an HTTP request, grouped by URL, and the number of click traces per URL:
The traces generated in the frontend of a Hilla app currently have no connection to traces in the backend of the same Hilla app. However, frontend and backend traces can be merged into distributed traces. This enables a much more comprehensive analysis of the request flow through the Hilla app. For this purpose, a suitable Propagator is configured in the OpenTelemetry setup in the Hilla frontend:
import { ZoneContextManager } from '@opentelemetry/context-zone';
import { CompositePropagator, W3CBaggagePropagator, W3CTraceContextPropagator } from '@opentelemetry/core';
import { OTLPTraceExporter } from '@opentelemetry/exporter-trace-otlp-http';
import { registerInstrumentations } from '@opentelemetry/instrumentation';
import { DocumentLoadInstrumentation } from '@opentelemetry/instrumentation-document-load';
import { FetchInstrumentation } from '@opentelemetry/instrumentation-fetch';
import { UserInteractionInstrumentation } from '@opentelemetry/instrumentation-user-interaction';
import { Resource } from '@opentelemetry/resources';
import {
  BatchSpanProcessor,
  SamplingDecision,
  WebTracerProvider,
} from '@opentelemetry/sdk-trace-web';
import { ATTR_SERVICE_NAME, ATTR_SERVICE_VERSION } from '@opentelemetry/semantic-conventions';

const resourceSettings = new Resource({
  [ATTR_SERVICE_NAME]: 'hilla-observability-example-frontend',
  [ATTR_SERVICE_VERSION]: '1.0.0',
});

const provider = new WebTracerProvider({
  resource: resourceSettings,
  sampler: {
    shouldSample: (_context, _traceId, spanName) => {
      return {
        decision: spanName == 'resourceFetch' ? SamplingDecision.NOT_RECORD : SamplingDecision.RECORD_AND_SAMPLED,
      };
    },
  },
});

const otlpTraceExporter = new OTLPTraceExporter({
  url: 'http://localhost:4318/v1/traces',
});

provider.addSpanProcessor(new BatchSpanProcessor(otlpTraceExporter));

provider.register({
  contextManager: new ZoneContextManager(),
  propagator: new CompositePropagator({
    propagators: [new W3CBaggagePropagator(), new W3CTraceContextPropagator()],
  }),
});

const startOpenTelemetryInstrumentation = () => {
  registerInstrumentations({
    instrumentations: [
      new FetchInstrumentation({
        ignoreUrls: [/VAADIN/],
      }),
      new DocumentLoadInstrumentation(),
      new UserInteractionInstrumentation(),
    ],
  });
};

startOpenTelemetryInstrumentation();
This propagator ensures that all HTTP requests from the frontend to the backend now contain an additional HTTP header traceparent. Further details on this mechanism can be found here, for example: https://www.w3.org/TR/trace-context/.
This header contains a Trace ID that was generated in the frontend. The backend uses this Trace ID to record the request flow and other downstream method calls in the backend. In a trace backend, this enables a coherent analysis of frontend and backend spans that belong to a Trace ID:

Logging
Logging in the frontend of a SPA is a special topic. It is easy to write log messages to the browser console via console.log, but this is not helpful for applications in production, as this information is not available to developers. Handling (un)expected errors is also a challenge. Error information is needed by developers for problem analysis, but is located in the user’s browser.
The concept of an error boundary is available for handling unexpected errors in the React frontend of a Hilla app. If an unhandled exception occurs in the React frontend, this exception can be recorded and processed by the error boundary. In this way, the error information can be processed in a specific way and users can be provided with helpful error information.
Such an error boundary component can be added to a Hilla project via the react-error-boundary package, for example:
npm install react-error-boundary
The component can then be integrated at the highest possible level in the React tree of the Hilla frontend, for example in the file src/main/frontend/views/@layout.tsx:
import { CustomFallbackComponent, handleError } from 'Frontend/components/CustomErrorBoundary';
import { ErrorBoundary } from 'react-error-boundary';
...

export default function MainLayout() {
  ...
  return (
    <ErrorBoundary FallbackComponent={CustomFallbackComponent} onError={handleError} >
      <AppLayout primarySection="drawer">
        ...
      </AppLayout>
    </ErrorBoundary>
  );
}
A separate component can be defined for the FallbackComponent property, which is rendered in the event of an error to display error information to users. This can be helpful or desired if you do not want to show users any overly technical error details or stack traces.
import { Button } from '@vaadin/react-components';
import { FallbackProps } from 'react-error-boundary';

const CustomFallbackComponent = ({ error, resetErrorBoundary }: FallbackProps) => {
  return (
    <div className="flex flex-col h-full items-center justify-center p-l text-center box-border">
      <p>Something went wrong:</p>
      <pre style={{ color: 'red' }}>{error.message}</pre>
      <Button onClick={() => resetErrorBoundary()}>Reset</Button>
    </div>
  );
};

export { CustomFallbackComponent };
A function can be specified for the onError property, which is also executed in the event of an error. Within this function, it is thus possible to transfer the error information to a suitable trace backend with the help of the Tracer from the OpenTelemetry setup of the React frontend:
import { Button } from '@vaadin/react-components';
import { FallbackProps } from 'react-error-boundary';
import { Span, SpanStatusCode, trace } from '@opentelemetry/api';

const tracer = trace.getTracer('hilla-observability-example-frontend', '1.0.0');

const handleError = (error: Error) => {
  tracer.startActiveSpan('errorBoundary', (span: Span) => {
    span.recordException(error);
    span.setStatus({
      code: SpanStatusCode.ERROR,
      message: error.message,
    });
    span.end();
  });
};

const CustomFallbackComponent = ({ error, resetErrorBoundary }: FallbackProps) => {
  return (
    <div className="flex flex-col h-full items-center justify-center p-l text-center box-border">
      <p>Something went wrong:</p>
      <pre style={{ color: 'red' }}>{error.message}</pre>
      <Button onClick={() => resetErrorBoundary()}>Reset</Button>
    </div>
  );
};

export { CustomFallbackComponent, handleError };
Within the handleError function, an active span with the name errorBoundary is started via the tracer. The actual error, the error message and a suitable error code are then recorded within this span. This error information can then be evaluated in a suitable trace backend:
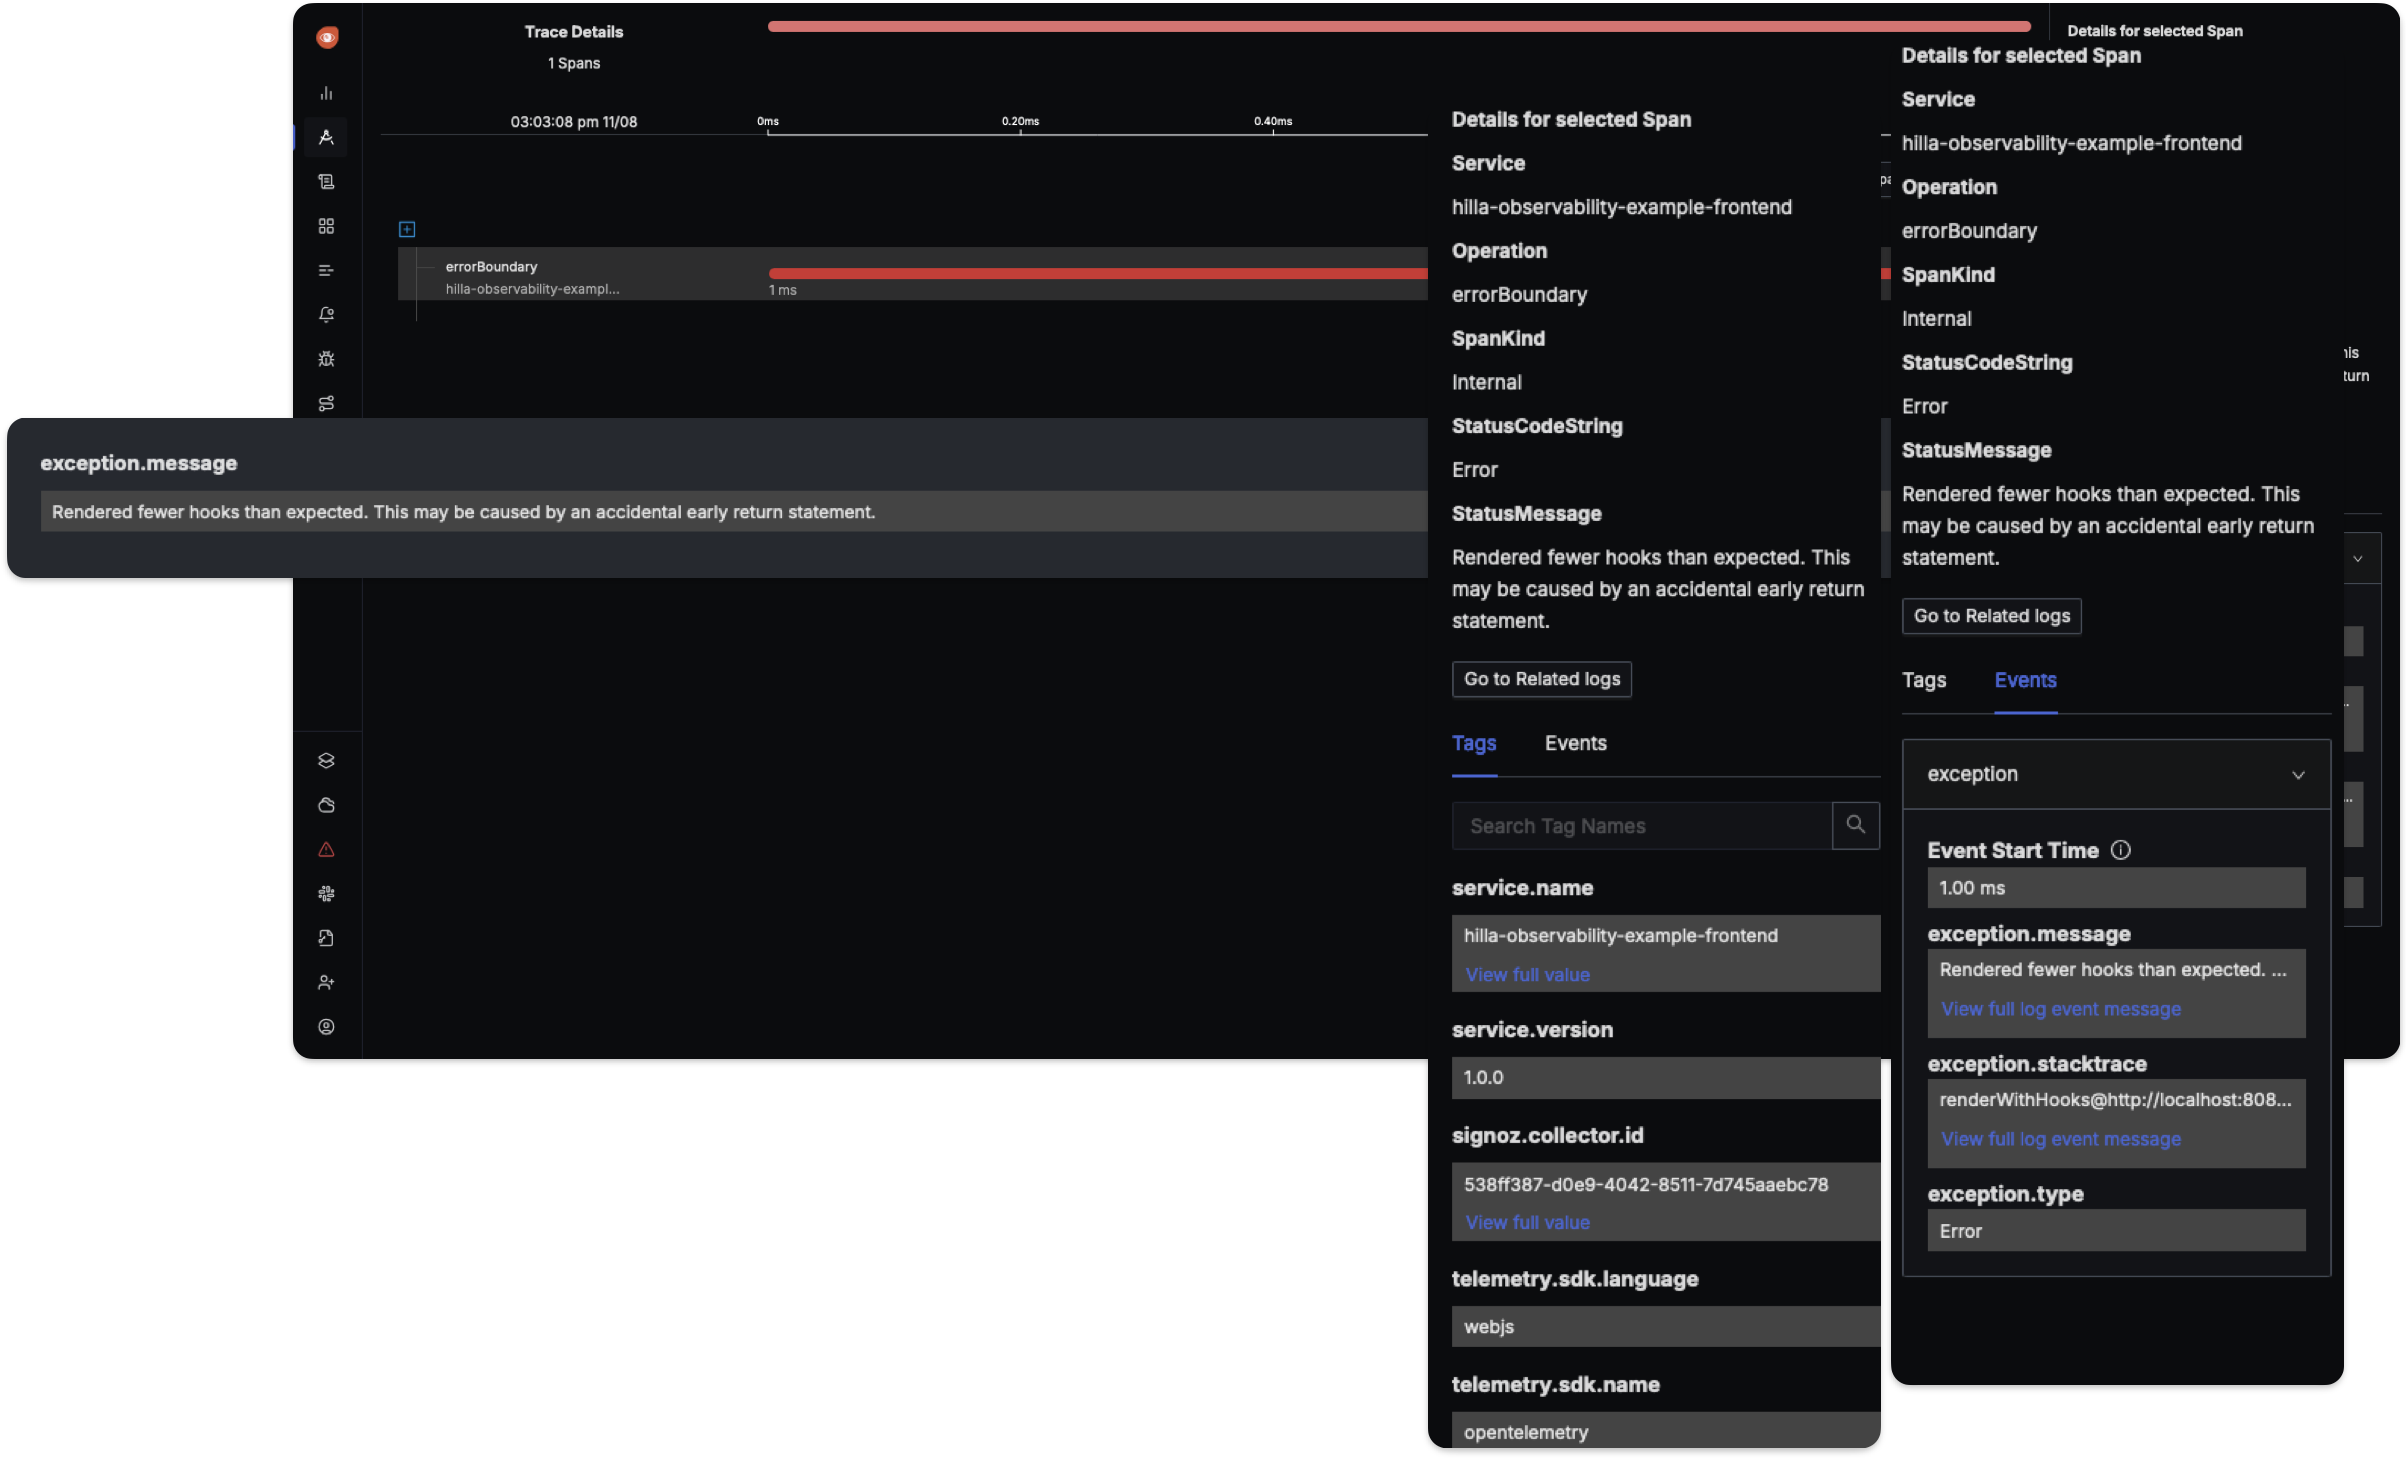
The spans that are created via the error boundary have the status ERROR. Other spans have the status UNSET or OK by default. Based on this information, dashboards or alerts can be created in a trace backend such as SigNoz, which can show when the proportion of faulty spans exceeds a configured limit, for example.
Metrics
The third area of observability for the React frontend of a Hilla app are metrics. Metrics can be used to collect information on availability or performance in the frontend. In order for metrics to be collected, a MeterProvider must first be initialized. It is provided via the package @opentelemetry/sdk-metrics:
npm install --save @opentelemetry/sdk-metrics
The file open-telemetry.ts can then be extended as follows:
...
import { metrics } from '@opentelemetry/api';
import { MeterProvider } from '@opentelemetry/sdk-metrics';
...

const meterProvider = new MeterProvider({
  resource: resourceSettings,
});

metrics.setGlobalMeterProvider(meterProvider);
The metrics created can be transferred to a suitable metrics backend via the OpenTelemetry Protocol (OTLP) and a suitable MetricExporter. The OTLPMetricExporter is provided via the package @opentelemetry/exporter-metrics-otlp-http:
npm install --save @opentelemetry/exporter-metrics-otlp-http
The file open-telemetry.ts can then be extended as follows:
...
import { metrics } from '@opentelemetry/api';
import { OTLPMetricExporter } from '@opentelemetry/exporter-metrics-otlp-http';
import { MeterProvider, PeriodicExportingMetricReader } from '@opentelemetry/sdk-metrics';
...

const metricReader = new PeriodicExportingMetricReader({
  exporter: new OTLPMetricExporter({
      url: "http://corporate.observability.example.com:4318/v1/traces",
  }),
  // Export metrics every 10 seconds.
  exportIntervalMillis: 10000,
});

const meterProvider = new MeterProvider({
  resource: resourceSettings,
  readers: [metricReader],
});

metrics.setGlobalMeterProvider(meterProvider);
Individual metrics such as Counter or Histograms can be created with the help of the OpenTelemetry JavaScript SDK.
As an addition or alternative, existing metrics such as the so-called Web Vitals can also be integrated into the React frontend of a Hilla app. Web Vitals are an initiative by Google. They provide various metrics that can be used to measure the user experience in a web app.
Based on the Web Vital LCP, the use will be shown as an example. LCP stands for Largest Contentful Paint. LCP can be used to measure the perceived loading speed of a page within a web app. To do this, LCP measures the time at which the main content of a page is fully loaded. According to Google, a web app has a good user experience if the pages of the web app have an LCP of 2.5 seconds or less.
To check the LCP metrics for the views in the React frontend of a Hilla app, the web-vitals package can be installed:
npm install --save web-vitals
Afterwards, the existing OpenTelemetry setup can be extended as follows:
...
import { metrics } from '@opentelemetry/api';
import { OTLPMetricExporter } from '@opentelemetry/exporter-metrics-otlp-http';
import { MeterProvider, PeriodicExportingMetricReader } from '@opentelemetry/sdk-metrics';
import { onLCP } from 'web-vitals';
...

const metricReader = new PeriodicExportingMetricReader({
  exporter: new OTLPMetricExporter({
      url: "http://corporate.observability.example.com:4318/v1/traces",
  }),
  // Export metrics every 10 seconds.
  exportIntervalMillis: 10000,
});

const meterProvider = new MeterProvider({
  resource: resourceSettings,
  readers: [metricReader],
});

metrics.setGlobalMeterProvider(meterProvider);

const meter = metrics.getMeter('web-vitals');
const lcp = meter.createObservableGauge('lcp');
onLCP((metric) => {
  lcp.addCallback((result) => {
    result.observe(metric.value);
  });
});
In a suitable backend, dashboards can be created based on this metric, for example:
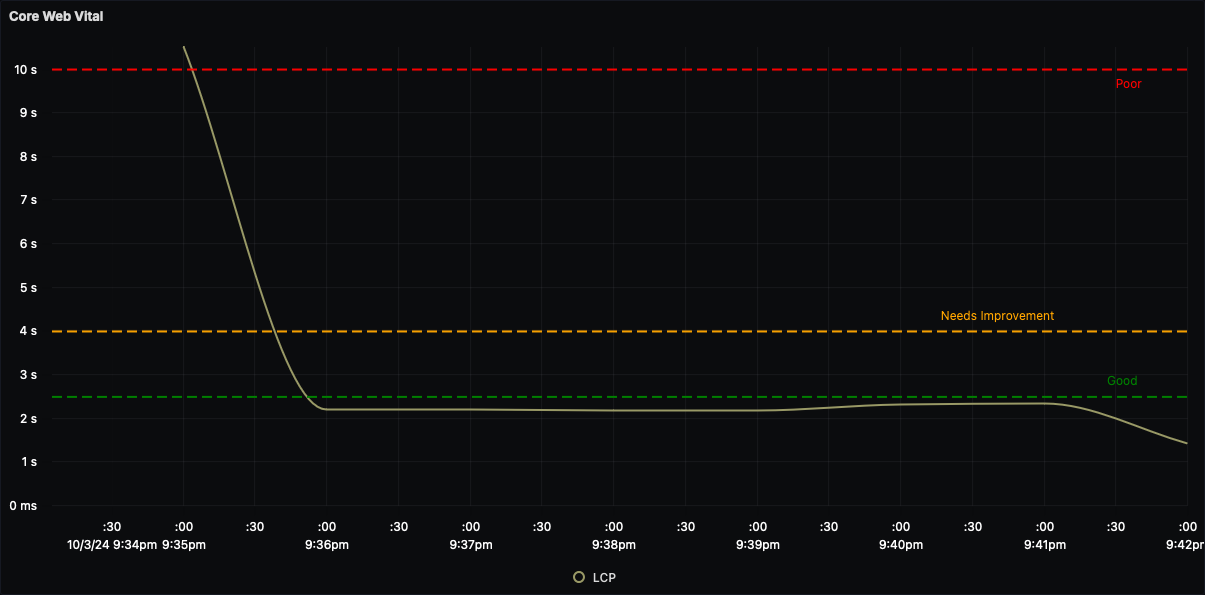
It would also be feasible to create an alert that sends a notification if the LCP value is too low over a longer period of time.
Summary
Realizing observability with traces, logs and metrics for the React frontend of a Hilla app involves a bit of work and the setup shown will probably change at one point or another in the future, as this field is still relatively new or is still undergoing continuous development. In conjunction with a suitable backend such as SigNoz, the collected observability data can be aggregated and analyzed very well in order to obtain the most comprehensive overview possible of availability, performance and problems in the React frontend of a Hilla app.
In combination with the continuous observation of the Spring Boot backend of a Hilla app, a very comprehensive picture of the entire Hilla app can be achieved.
