Article series
This is the first of two articles describing different aspects of observability of Hilla apps:
“Everything fails, all the time”
This well-known quote from AWS CTO Werner Vogels briefly describes a central motivation for the continuous monitoring of systems and applications. Failures must be detected at an early stage and analyzed with the help of as much information as possible. Observability can be a helpful approach here. Observability is the ability to observe the internal state of a running application from the outside. To achieve this, observability consists of three pillars: Logging, Traces and Metrics.
Observability for Spring Boot
The backend of a Hilla app is based on Spring Boot by default. Fortunately, there is a whole range of tools for continuously observing a Spring Boot-based backend using the observability approach. In the context of this article, OpenTelemetry and Micrometer are used for this purpose.
OpenTelemetry is an open-source and vendor-neutral collection of APIs, SDKs and tools. With the help of OpenTelemetry, telemetry data such as logs, traces and metrics can be generated, collected and exported. OpenTelemetry integrates with many popular libraries and frameworks, including Spring Boot and React. Java applications can use the OpenTelemetry Java-Agent without additional code changes. However, as the Java agent does not support Native Images, the code-based approach to instrumentation is considered in this article.
Micrometer is also open source and vendor-neutral. It provides a facade for the most common observability systems and enables JVM-based applications to be instrumented.
OpenTelemetry and Micrometer complement each other very well and are therefore a good choice for the continuous observation of a Spring Boot backend.
Setup
The integration of OpenTelemetry into the Spring Boot backend of a Hilla app begins with the addition of the required dependencies:
<dependency>
    <groupId>io.opentelemetry</groupId>
    <artifactId>opentelemetry-sdk</artifactId>
</dependency>
<dependency>
    <groupId>io.opentelemetry.semconv</groupId>
    <artifactId>opentelemetry-semconv</artifactId>
    <version>1.27.0-alpha</version>
</dependency>
Additional configuration is not required at the moment and will follow later.
Tracing
Tracing is helpful to understand the request flow in a Hilla app: Starting with an HTTP request, through method calls to database queries. Trace IDs and Span IDs play an important role in this context, as they help us to recognize related actions.
Tracing can be implemented for the backend of a Hilla app using Spring Boot Actuator and Micrometer Tracing. To do this, a few more dependencies must first be added to the Hilla project:
<dependency>
    <groupId>org.springframework.boot</groupId>
    <artifactId>spring-boot-starter-actuator</artifactId>
</dependency>
<dependency>
    <groupId>io.micrometer</groupId>
    <artifactId>micrometer-tracing-bridge-otel</artifactId>
</dependency>
<dependency>
    <groupId>io.opentelemetry</groupId>
    <artifactId>opentelemetry-exporter-otlp</artifactId>
</dependency>
The first dependency is for Spring Boot Actuator. Fortunately, Spring Boot Actuator offers an auto-configuration for Micrometer Tracing. This means, among other things, that Micrometer Tracing provides the Trace IDs and Span IDs as MDC attributes, which is very useful for combining traces and log outputs later on.
The two other dependencies ensure that the traces collected by Micrometer can be transferred to OpenTelemetry and can be exported to a suitable backend using the OpenTelemetry Protocol (OTLP).
Tracing can then be configured further:
management.tracing.sampling.probability=1.0
management.otlp.tracing.endpoint=http://corporate.observability.example.com:4317/v1/traces
By default, Spring Boot Actuator would only create and export traces for 10% of all requests, to avoid overwhelming the trace backend. This configuration can be changed to 100%, for example, so that traces are sent to the trace backend for every request. This can be helpful during local development, for example.
In addition, the endpoint for a suitable trace backend to whom all traces will be exported is defined in the configuration. In this example, SigNoz is used as a backend.
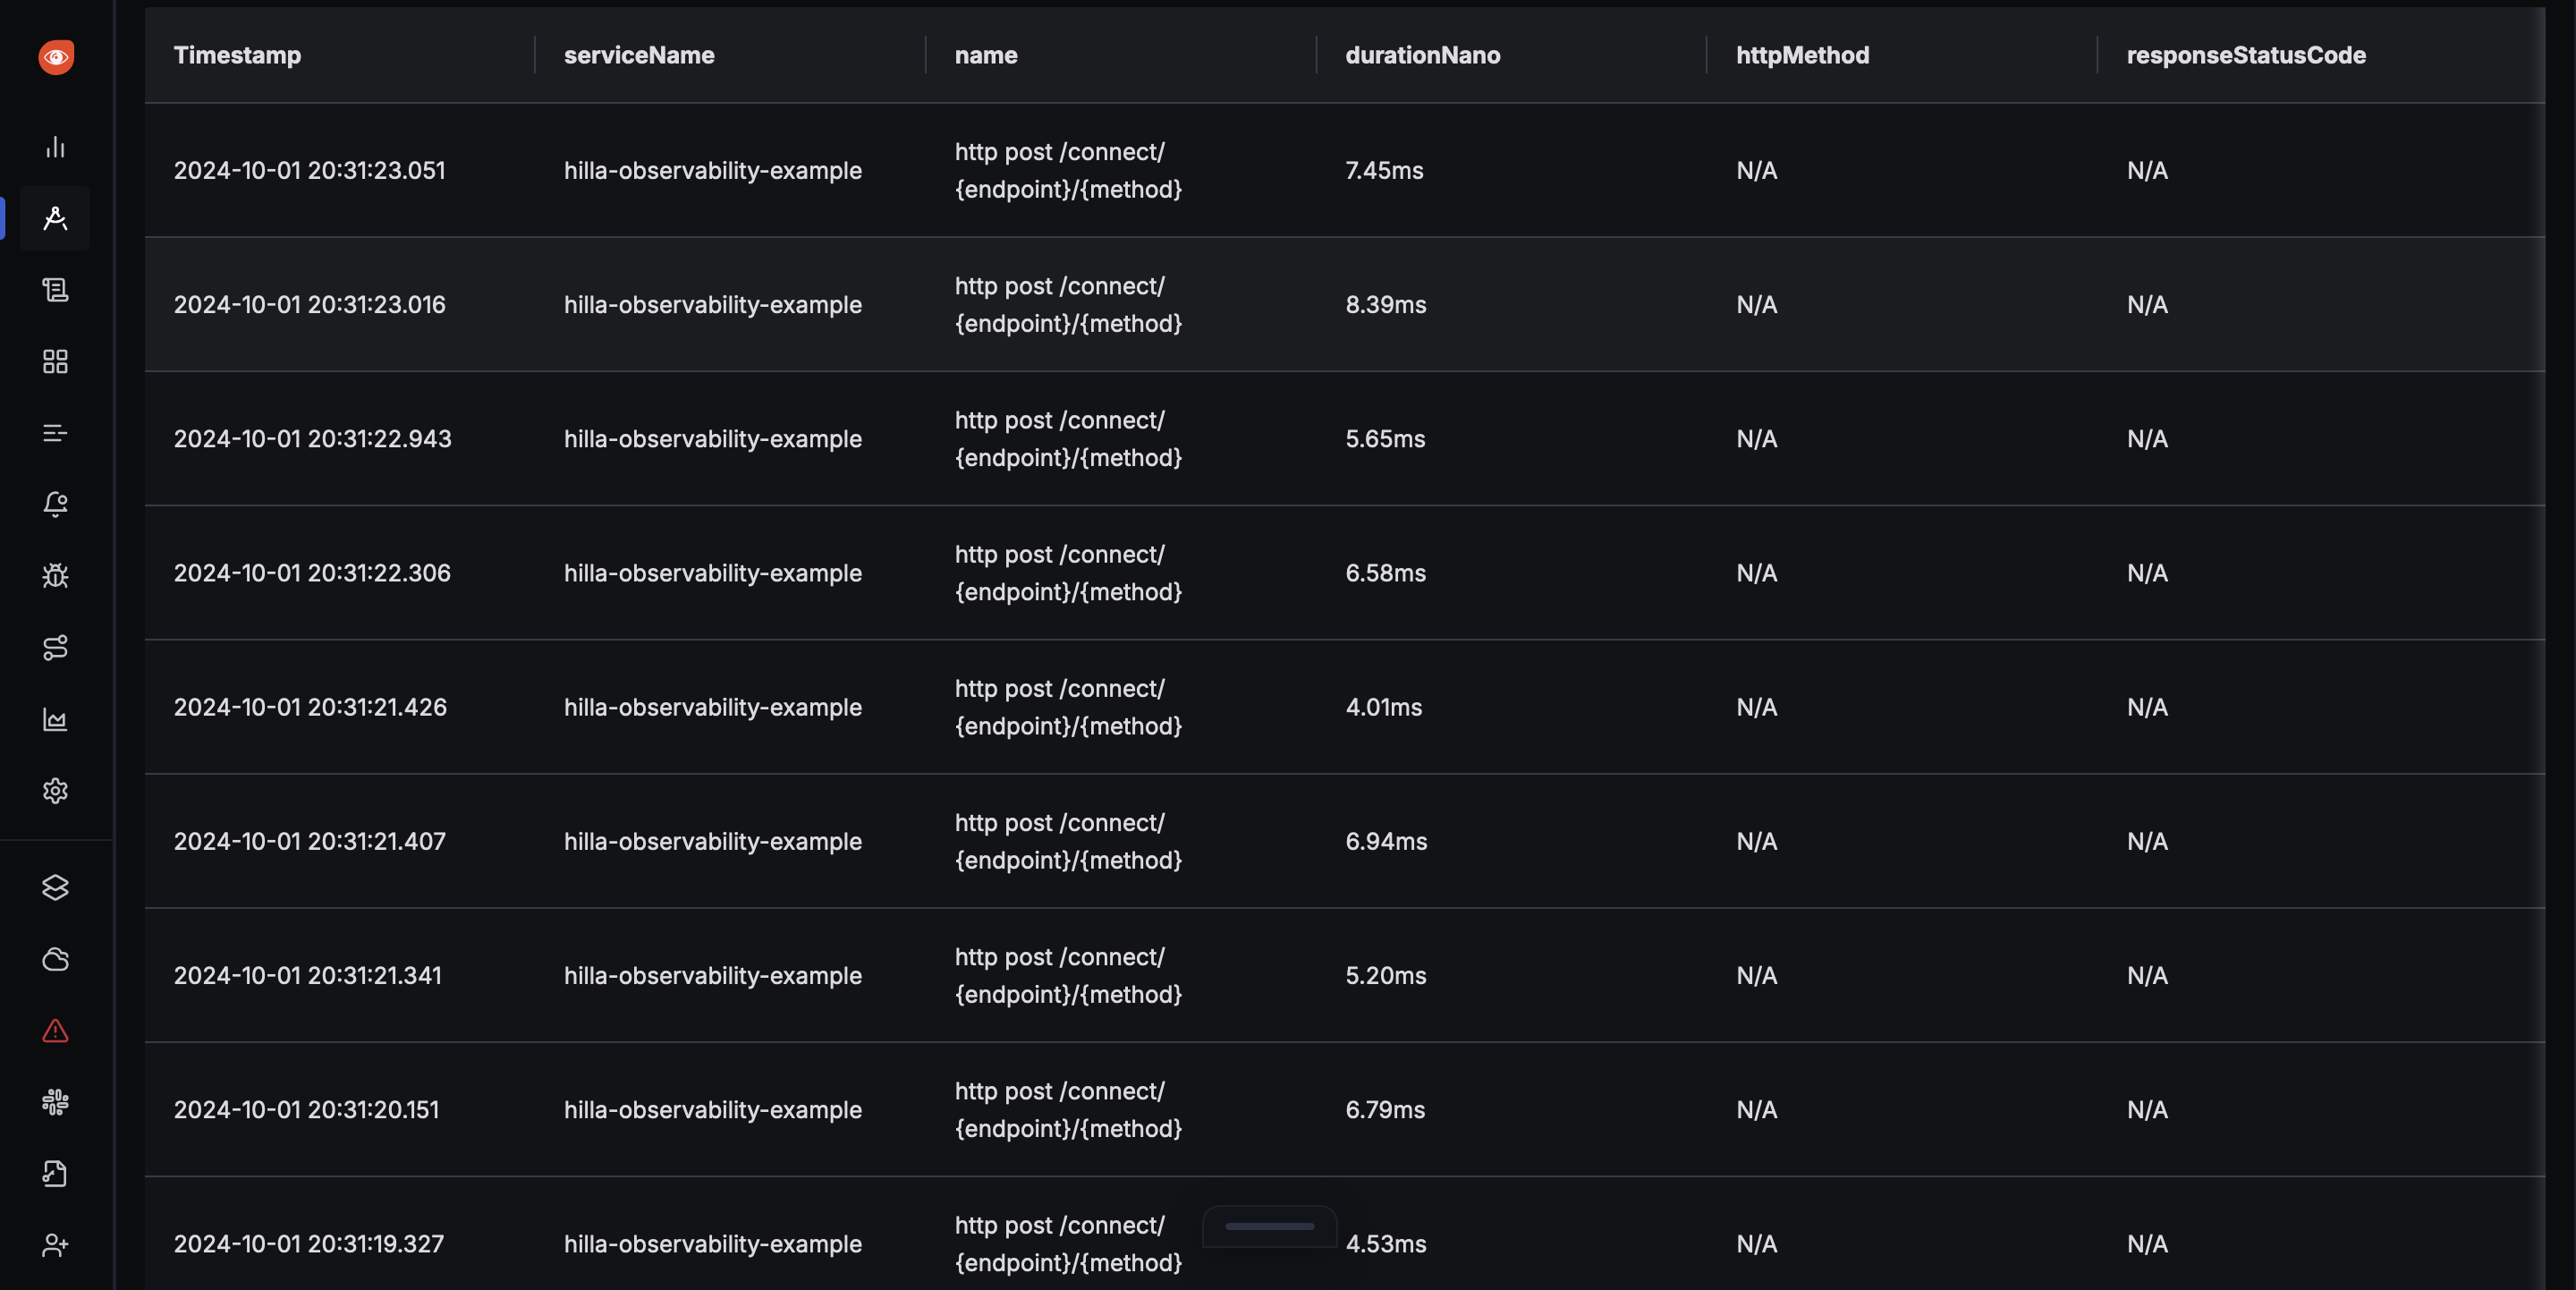
The configuration shown is sufficient so that traces for all HTTP requests from the frontend to the backend of a Hilla app can now be exported to the trace backend and can be analyzed there:
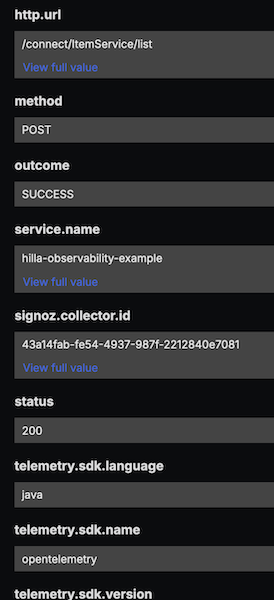
Detailed information such as URL, HTTP method and HTTP status code can be viewed for each trace:
In addition, the duration of requests is also available as a metric, so that dashboards can be created with the duration of requests, for example:

Additionally to the traces shown, you can use the Micrometer Observation API to create custom spans to observe certain functionality in the Hilla app.
import java.util.List;
import org.springframework.beans.factory.annotation.Autowired;
import com.example.application.entities.Label;
import com.example.application.repositories.LabelRepository;
import com.vaadin.flow.server.auth.AnonymousAllowed;
import com.vaadin.hilla.BrowserCallable;
import com.vaadin.hilla.crud.CrudRepositoryService;
import io.micrometer.observation.Observation;
import io.micrometer.observation.ObservationRegistry;

@BrowserCallable
@AnonymousAllowed
public class LabelService extends CrudRepositoryService<Label, Long, LabelRepository> {

    @Autowired
    private ObservationRegistry observationRegistry;

    public List<Label> getLabels() {
        Observation observation = Observation.start("get-labels", observationRegistry);
        List<Label> labels = super.getRepository().findAll();
        observation.stop();
        return labels;
    }
}
In the code example, a separate span with the name get-labels is created. The span records the execution of a Spring Data Repository method. In the trace backend, this span can then be analyzed in conjunction with the already known traces.

Logging
Logs play an important role in observability, as they can contain a lot of valuable information that can be useful for observing a Hilla app and analyzing errors. In the context of observability, logging is about connecting the existing log outputs with the other telemetry data available. To achieve this, the log outputs must first be made available for OpenTelemetry. This can be done via a Log-Appender for Logback, for example. To do this, the following dependency must first be added to the Hilla project:
<dependency>
    <groupId>io.opentelemetry.instrumentation</groupId>
    <artifactId>opentelemetry-logback-appender-1.0</artifactId>
    <version>2.8.0-alpha</version>
</dependency>
This appender can then be added to the existing logback configuration:
<?xml version="1.0" encoding="UTF-8"?>
<configuration>
    <include resource="org/springframework/boot/logging/logback/defaults.xml"/>
    <include resource="org/springframework/boot/logging/logback/console-appender.xml" />
    <appender name="OpenTelemetry" class="io.opentelemetry.instrumentation.logback.appender.v1_0.OpenTelemetryAppender">
        <captureExperimentalAttributes>true</captureExperimentalAttributes>
        <!-- Micrometer adds MDC attributes 'traceId' and 'spanId' -->
        <captureMdcAttributes>*</captureMdcAttributes>
    </appender>
    <root level="INFO">
        <appender-ref ref="CONSOLE" />
        <appender-ref ref="OpenTelemetry"/>
    </root>
</configuration>
The configuration for the appender also specifies that existing MDC attributes such as Trace ID and Span ID should be taken into account and included in the log output. Fortunately, Micrometer Tracing provides the Trace ID and Span ID per MDC exactly for these purposes.
In order to use the appender correctly, the OpenTelemetry SDK must first be initialized for the Hilla app and configured for the appender. This should be done as early as possible and can be done, for example, in the Application.java file in the Hilla project:
import com.vaadin.flow.component.page.AppShellConfigurator;
import com.vaadin.flow.theme.Theme;
import io.opentelemetry.api.OpenTelemetry;
import io.opentelemetry.exporter.otlp.logs.OtlpGrpcLogRecordExporter;
import io.opentelemetry.instrumentation.logback.appender.v1_0.OpenTelemetryAppender;
import io.opentelemetry.sdk.OpenTelemetrySdk;
import io.opentelemetry.sdk.logs.SdkLoggerProvider;
import io.opentelemetry.sdk.logs.export.BatchLogRecordProcessor;
import io.opentelemetry.sdk.resources.Resource;
import io.opentelemetry.semconv.ServiceAttributes;
import org.springframework.boot.SpringApplication;
import org.springframework.boot.autoconfigure.SpringBootApplication;

@SpringBootApplication
@Theme(value = "hilla-observability-example")
public class Application implements AppShellConfigurator {

    public static void main(String[] args) {
        // Initialize OpenTelemetry as early as possible
        OpenTelemetry openTelemetry = initializeOpenTelemetry();

        // Install OpenTelemetry in logback appender
        OpenTelemetryAppender.install(openTelemetry);

        SpringApplication.run(Application.class, args);
    }

    private static OpenTelemetry initializeOpenTelemetry() {
        OpenTelemetrySdk sdk =
            OpenTelemetrySdk.builder()
                .setLoggerProvider(
                    SdkLoggerProvider.builder()
                        .setResource(
                            Resource.getDefault().toBuilder()
                                .put(ServiceAttributes.SERVICE_NAME, "hilla-observability-example")
                                .build())
                        .addLogRecordProcessor(
                            BatchLogRecordProcessor.builder(
                                    OtlpGrpcLogRecordExporter.builder()
                                        .setEndpoint("http://corporate.observability.example.com:4317")
                                        .build())
                                .build())
                        .build())
                .build();

        // Add hook to close SDK, which flushes logs
        Runtime.getRuntime().addShutdownHook(new Thread(sdk::close));

        return sdk;
    }
}
The OpenTelemetry SDK is created with a LoggerProvider. This receives a LogRecordProcessor in conjunction with a LogRecordExporter. The latter transfers the log outputs from the appender to a suitable backend via the OpenTelemetry protocol (OTLP).
In a suitable backend, such as SigNoz, for example, all log outputs of the Spring Boot backend of the Hilla app can now be analyzed.
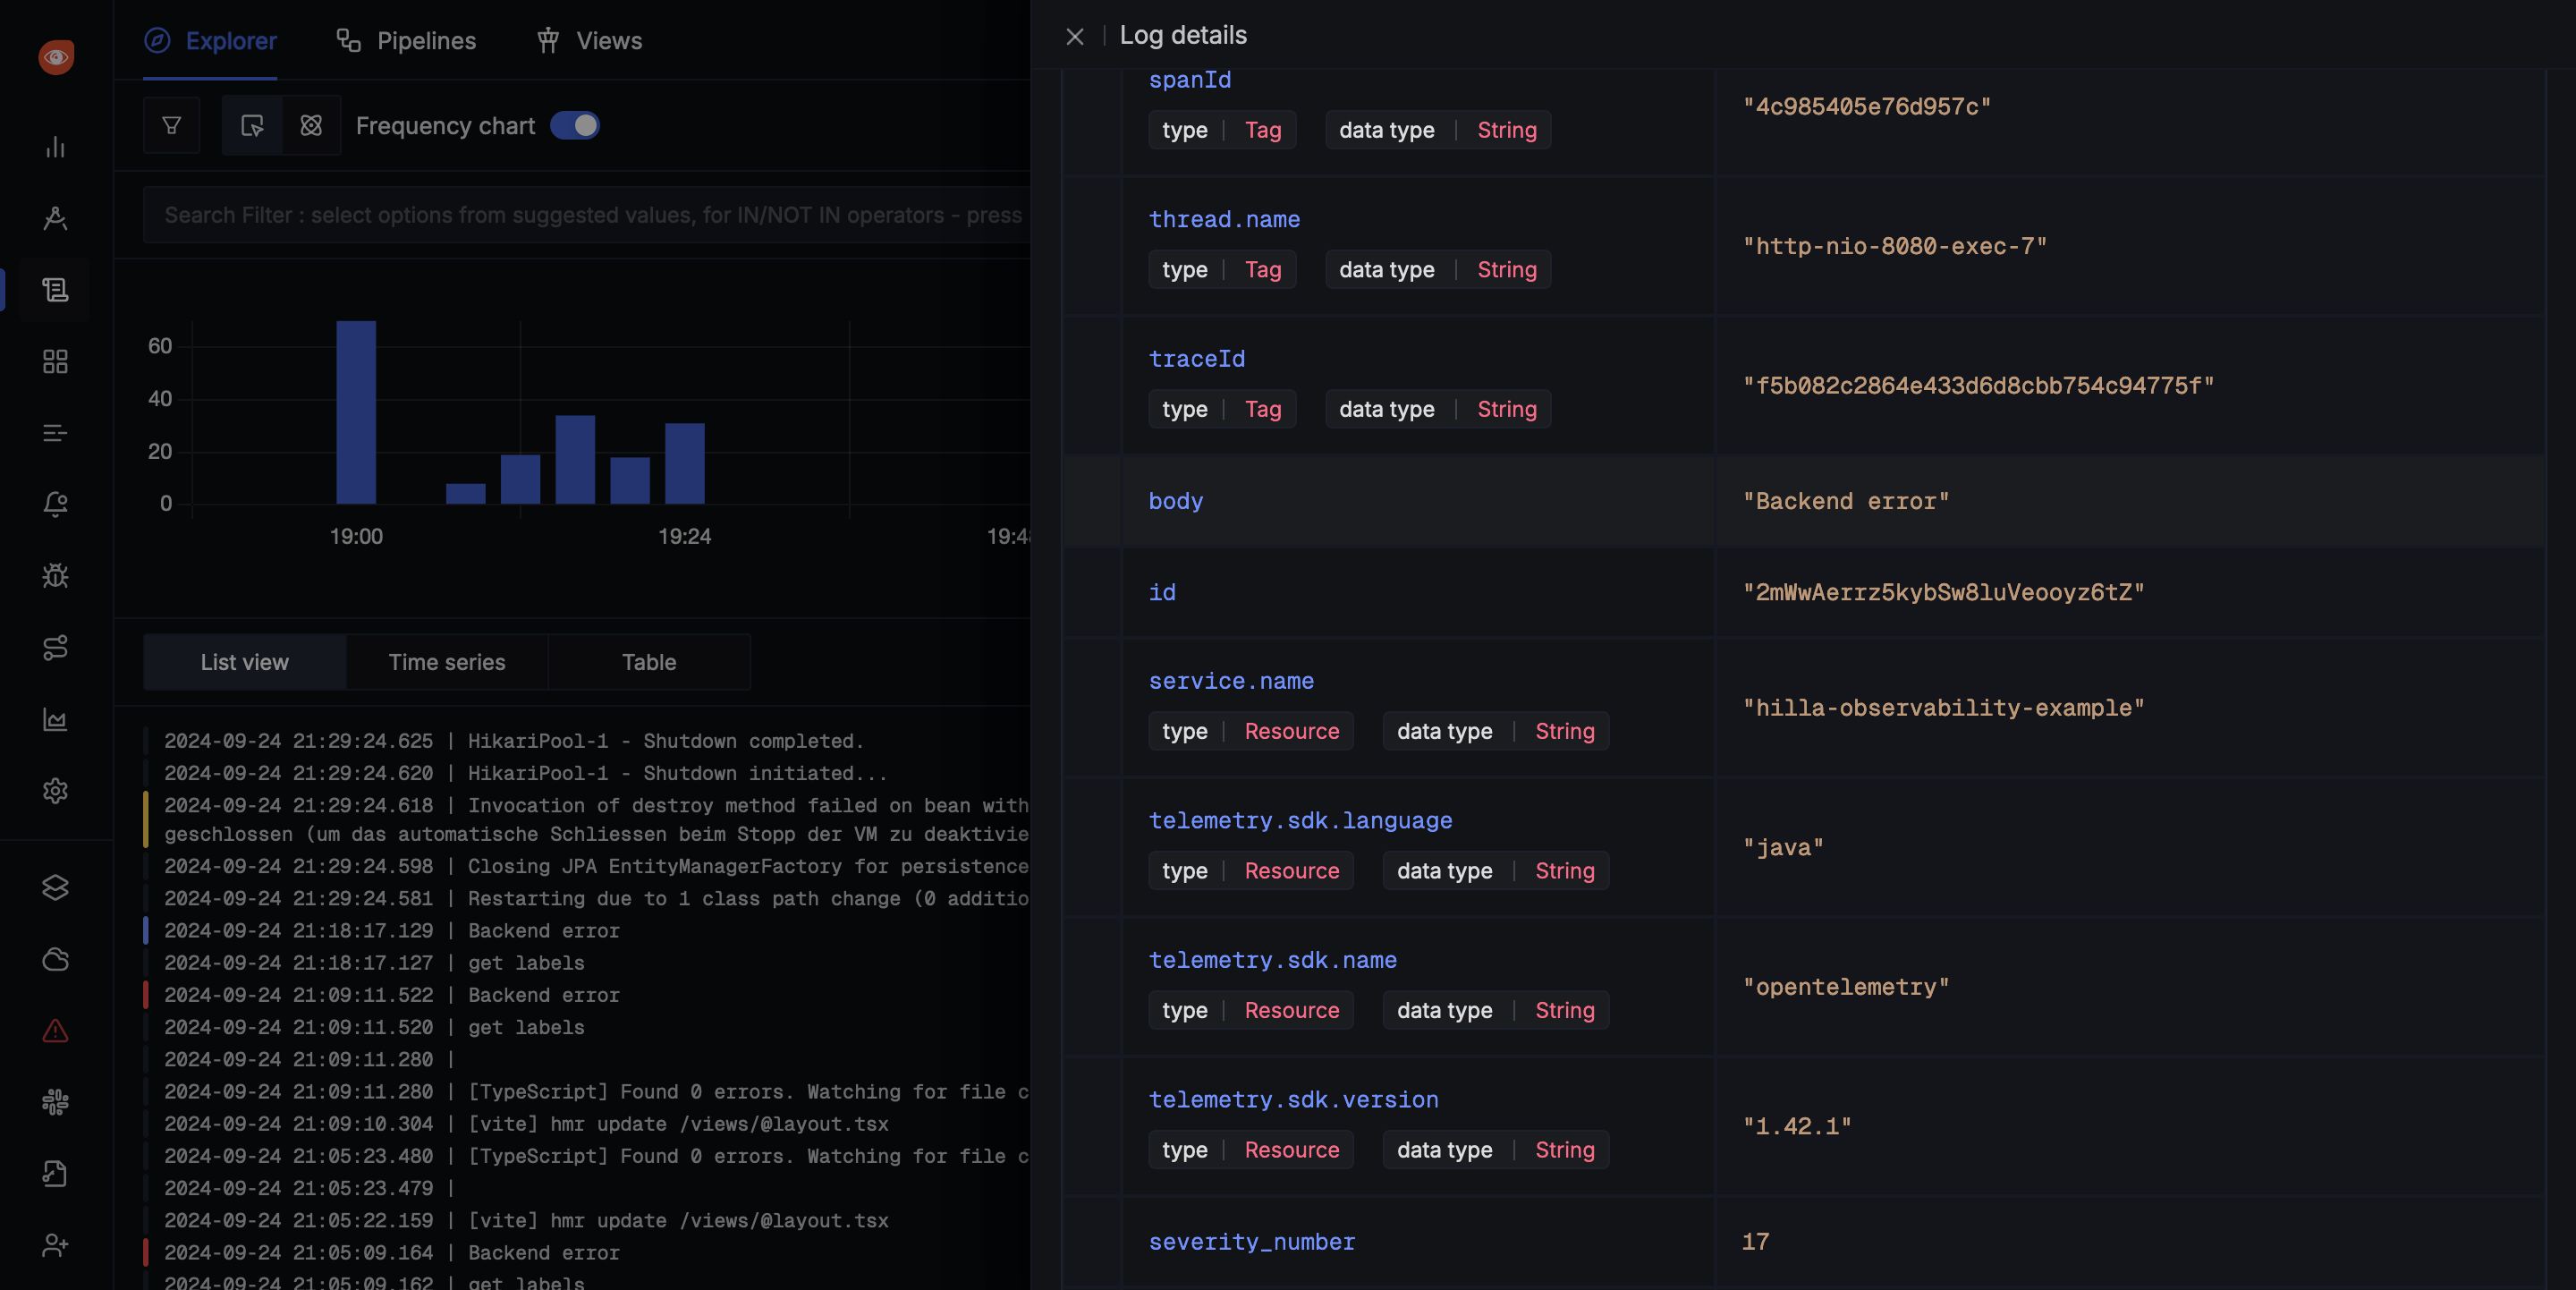
In addition to the name of the Hilla app, which was configured as a Resource in the LoggerProvider, the actual log message and the Trace ID and Span ID are also visible.
Based on this log data, alerts or dashboards, for example, can now be created in a suitable backend.
Metrics
The third and final pillar of observability for the Spring Boot backend of a Hilla app are metrics. Metrics are useful for observing the state of various components of an application. Spring Boot Actuator supports Micrometer Metrics for the creation of metrics. Spring Boot Actuator automatically creates the MeterRegistry required for this. The following dependency must be added to the Hilla project in order for the collected metrics to be exported:
<dependency>
    <groupId>io.micrometer</groupId>
    <artifactId>micrometer-registry-otlp</artifactId>
</dependency>
Afterwards, the URL of a suitable backend can be configured to whom the metrics are to be transferred using the Open Telemetry Protocol (OTLP):
management.otlp.metrics.export.url=http://corporate.observability.example.com:4318/v1/metrics
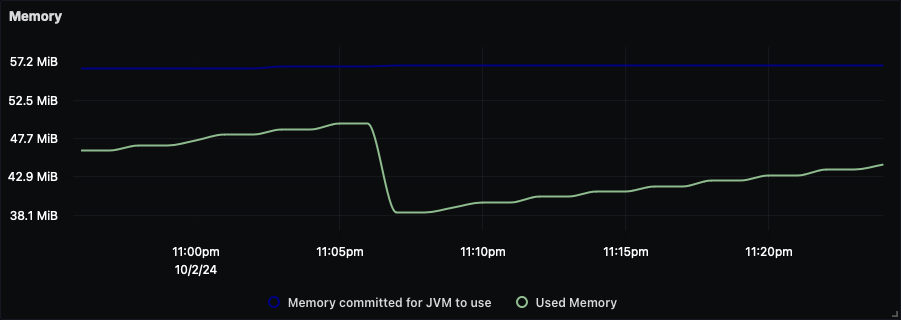
Fortunately, Spring Boot Actuator supports a variety of different metrics without additional configuration. For example, JVM metrics such as memory consumption, the number of active threads or the number of loaded classes can be observed.
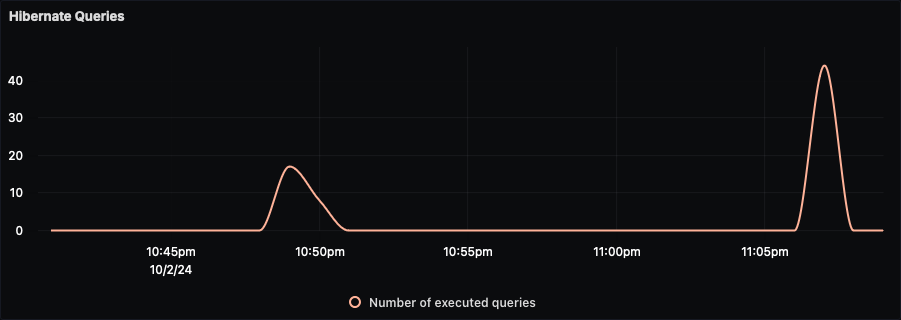
There are also metrics available for other components of a Hilla app, for example for Hibernate, JDBC or Spring Data. The following picture shows a dashboard in SigNoz with the number of database queries executed.
Summary
Logs, traces and metrics can be generated or collected for the Spring Boot backend of a Hilla app with the help of OpenTelemetry and Micrometer. The collected information can be transferred via the OpenTelemetry protocol (OTLP) to a suitable backend such as SigNoz, where it can be analyzed and evaluated. This provides a wide range of useful information in one central place to continuously observe a Hilla app and to detect errors and problems as early as possible.
Part 2 of the article series deals with observability for the React frontend of a Hilla app.
